Teams, Folders, Organisations … and Provisioning.
What’s up with that?
I use Grafana to display data about IoT devices (PhiSaver). It’s all stored in a single DB. This Db cannot have access controls, so access control is done at the front end (i.e. Grafana). This post is about how to use Grafana to achieve that goal.
Requirements
- About 100 devices. Each device has a human user, or many. Some devices are grouped into
Fleets.This grouping/M2M arrangement is done elsewhere in a SQL database. - For Grafana, each
Devicemaps to a GrafanaUser. Human users of the device share this Grfana login. The Grafana login (e.g. xy123 / password) has a autologin feature. - Security – tenants shouldn’t be able to see each others’ data.
Broad Options
- Have all human users as
Usersin Grafana. They login via OAuth I guess. They have a list ofDevicesthey can view. I can’t see how to do this. We really want a single ‘standard’ dashboard… so… - Forget the human users. They won’t login manually – they will be given a special login code which logs them in to a
Device. The device username (e.g. xy123) is used to limit queries to that device in the database.
Let’s go with #2
Massive Caveat
While investigating this, I realised Grafana is fundamentally unsuited to some use-cases. See this (short) discussion and another answer. Giving a Grafana dashboard access to a data source actually gives the user the power to execute arbitrary queries on that datasource. So if many tenants are in one database, they can see other tenants’ data. This is because Grafana constructs queries in the front-end, so the query is visible/modifiable by the client browser.
This data is not publicly available (i.e. you need to login), but cross-tenant privacy needs addressing. Depending on the data (if it’s not credit card details!) this might be possible to manage…
Some options:
- Don’t use Grafana – use something that does backend queries. We’d miss the interactiveness of Grafana. Maybe Plotly.py is worth investigating? Is it secure in this case?
- For influx data, it’s not practical to ‘split’ the database into tenants. Instead, we use non-identifiable data in influx. IoT devices are randomly assigned identifiers and we display this ‘anonymous’ data. Then in a separate database (which we secure) there is a mapping of ID to real-world details (name, address, etc). This database (e.g. postgres) can have row-level security (ref1 ref2). In Grafana, we’d need separate organisations (and data sources) to limit access to certain rows. This is a bit against the framework grain (see ‘Teams’ below).
- Don’t use SQL with Grafana. As noted in #2, influx anonymous data is maybe ok. Display SQL data in something like Django (SQL in the backend, so multi-tenant ‘secure’ in this sense). Then have iframes showing panels. You can’t show the whole dashboard. Separate iframes wouldn’t synchronise the time range between them. Authentication is tricky. This method will like a bit of a mess I reckon.
- Keep Grafana for ‘in-depth’ analysis. This is just a login-link to a non-identifiable Grafana dashboard using ${user.login} is key to data. Separate to that, use something else (e.g. Plotly) to display more basic, user-friend data within Django. We already have python code to run flux queries to securely extract the data, then I guess we pass it to the front-end Plotly somehow.
In summary: jeez.
Organisations Solution (boo)
The Grafana Blog from 2022 says, in short, “use Teams not Orgs”. I did use orgs (one per device) and it works. But it’s ‘fighting against the framework’. It’s hard to provision (I did have to use the API and ‘manually automate’) dashboards, permissions, etc. You need one dashboard per org and it’s a huge redundancy. At the start this was ok as I had different dashboards for everyone, but it’s not good for standardising. In the pit.
Unfortunately given the Massive Caveat, we’ll need Orgs to seperate data sources if we display SQL.
But most users don’t need this, so let’s use Teams for them and just show influx data.
Teams Solution (yay?)
Let’s make a single organisation with many Teams. (This covers single users (one device). Multi-device fleets will need SQL to label the devices. )
Devices (aka Grafana Users) are added to the Teams. We have a standard, singular device. All team members share one dashboard. The ${__user} variable is used to query the right Device in the database/s. This Team has permission to view that one dashboard, a standard UI preference and a standard ‘default dashboard’.
Folders
*If* the multi-tenant issue can be solved, we can group all users in one organisation, using teams and folder to restrict access.
Folders “group resources”. We can give a Team access to certain folders, so can have a folder structure like:
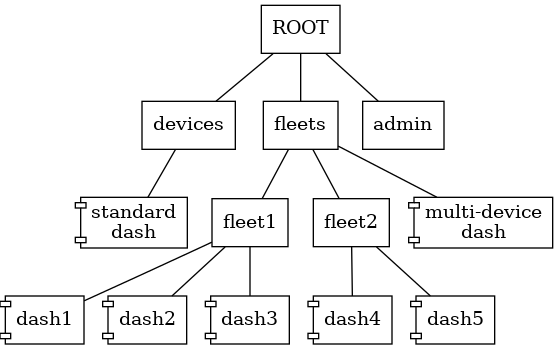
The multi-device dash can be made from the single-device dash with a minor automatable change. It would use the fleet prefix to search of fleet devices. This related not on the SQL database, but on convention. The dash[1-x] are completely new. They could be stored as provisioned dashboards too, but would be individually created.
Provisioning
Previously I use the API to automate updates to dashboard. Now (2023) provisioning looks like a better bet. The provisioning documentation is ok, if sparse. There’s also a Grafana tutorial. Some hitches and notes:
- Can’t commission organisations. That’s a good reason to not use them! Coincidence?
- Can’t template dashboards with external variable (like “Device ref”). Use ${org}/${user} instead and convention in Device names.
Implementation
Create a folder structure in project (saved via git):
├── admin
├── devices
│   └── phisaver-energy-monitor.json
└── fleets
    ├── phisaver-energy-monitor-multi.json
    ├── rc
    │   ├── aggregated-devices.json
Write a little script to copy these into /var/lib/grafana/dashboards:
python3 phigrafana.py made-multi ~/phisaver/grafana/provisioning/dashboards/devices/phisaver-energy-monitor.json > ~/phisaver/grafana/provisioning/dashboards/fleets/phisaver-energy-monitor-multi.json
sudo cp -r ~/phisaver/grafana/provisioning/dashboards/* /var/lib/grafana/dashboards/
sudo chown -R grafana:grafana /var/lib/grafana/dashboards/*
(First line: a bit of python code to change JSON to derive “-multi” dashboard by converting constant variable to query variable.)
References
- Grafana Blog on “How best to
- Provisioning
- Variable referencing org/user