This are my notes on setting up InfluxDBv2 for storing Iotawatt power readings. Specifically I needed to:
- Transition a live site from InfluxDB1 to InfluxDB2
- Setup InfluxDBv2 to use InfluxDBv1 api and auth, so that ‘old’ IotaWatts can continue to post data
- Setup tasks (pka Continuous Queries) to handle downsampling
- Setup retention periods and ‘prune’ existing data (1 billion points)
Install v2, Transfer Data (v1 to v2)
Good instructions on Influx website. Export v1 to line protocol, copy file, import from line protocol to v2.
Doing a everything-dump led to huge (100Gb) files and slow performance. A python script to batch (use -start, -end, -out) the processing is better.
To import, read the line-protocol files into a buckets. I did 1 week files, grouped by years.
for FILE in ./2019-*.inf; do influx write --bucket iotawatt --org phisaver -f $FILE --errors-file $FILE.error --skipHeader=5 ; done
A rough check (usewc -l) and
Data Schema
InfluxDB2 uses buckets structured as:
ORGANISATION
- DASHBOARDS
- TASKS
- USERS
- BUCKETS
- Retention period (applies to whole bucket)
- Data (records with fields, tags, timestamps)
| Bucket | Database | Retention Period | Period | Org | Note |
| iotawatt | phisaver | 1 week | 10s to 60s | phisaver* | |
| energy | phisaver | inf | 1 hour | phisaver* | |
| power | phisaver | inf | 5 minutes | phisaver* |
* the organisation could change to relate to fleets (eg. uq, cc, rc, general)
The DBRP mapping service uses the database and retention policy specified in 1.x compatibility API requests to route operations to a bucket.
Influx docs
This means we have:
- v1: [ database, retention policy ] which is mapped to
- v2: [ bucket ] which belongs to an organisation
Within both a [ database, retention policy ] and a [ bucket ] there are multiple measurements .
Within v1, I had a big [ phisaver, inf ] database with measurements of iotawatt,and energy.
In v2, I want [ iotawatt, 1w] bucket to record ‘raw’ readings, [ power, inf ], [ energy, inf] buckets to record downsampled data.
In v2, the [ iotawatt ] bucket has a Measurement iotawatt. The [power] and [energy] buckets have Measurements called either iotawatt or something else!
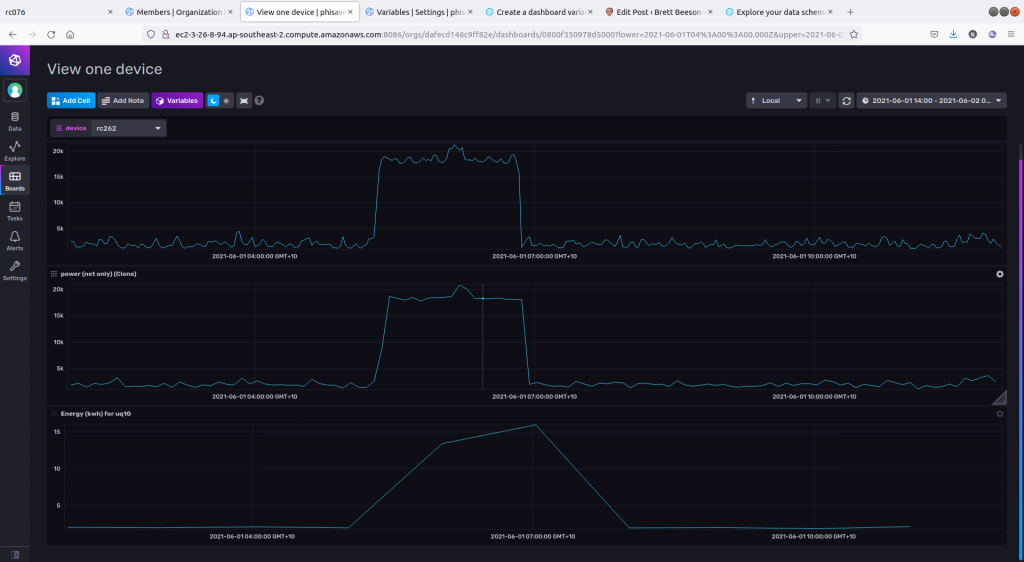
Let’s skip ahead to see the results of these three buckets for 12 hours of one sensor
- Top is ‘raw’ data in iotawatt (1m)
- Middle is downsampled power (5m): some loss of shape
- Bottom is downsample energy (1h): only the total (i.e. area under curve) is now useful.
Exploring the schema
Use the docs:
import "influxdata/influxdb/schema"

schema.measurementFieldKeys(
  bucket: "example-bucket",
  measurement: "example-measurement",
  start: -30d
)
Note the start defaults to start=30d.
Other functions are useful in checking tags. For example
import "influxdata/influxdb/schema"

schema.measurementTagKeys(
  bucket: "power",
  measurement: "iotawatt"
)
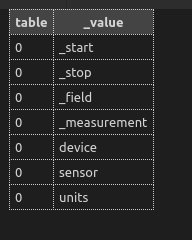
Which shows us we have “device”, “sensor” and “units” tags as expected.
To find all devices
import "influxdata/influxdb/schema"

schema.tagValues(
  bucket: "iotawatt",
  tag: "device",
  start: -1y    // default is only -30d
)
Let’s try another method with basic syntax, just for fun.
from(bucket: "noaa")
  |> range(start: 2021-06-01T00:00:00Z, stop: 2021-06-02T00:00:00Z)
  |> filter(fn: (r) => r["_measurement"] == "h2o_quality")
  |> group()
  |> keyValues(keyColumns: ["randtag"])
The output of the filter function is a set of tables, one for each combination of the tags (randtag and location, in this case). Hence the default is to group(*by-every-tag*).
The group() function ungroups everything.
Check the imported data
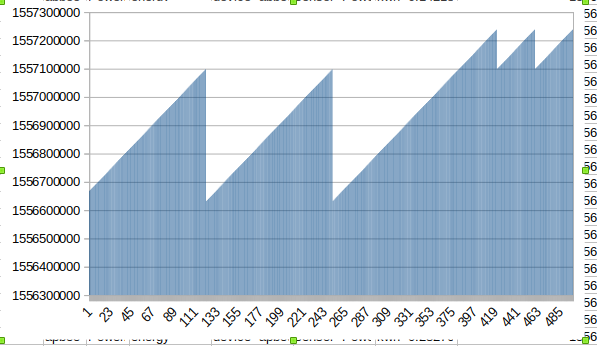
I checked the lines in a line protocol file and then counted points in the v2 database. They did not match. Eventually I found the same point (i.e. same timestamp) was included multiple (!) times in the line protocol line. See below.
Instead, we can use frequency count:
SELECT count("Watts") FROM "iotawatt" WHERE ("sensor" = 'Net') AND $timeFilter GROUP BY time(1d), "device" fill(null)
and compare this v1 to v2:
from(bucket: "iotawatt")
  |> range(start: v.timeRangeStart, stop: v.timeRangeStop)
  |> filter(fn: (r) => r["_measurement"] == "iotawatt")
  |> filter(fn: (r) => r["sensor"] == "Net")
  |> filter(fn: (r) => r["_field"] == "Watts")
  |> group(columns: ["device"])
  |> aggregateWindow(every: 1d, fn: count)
Once off mega tasks
Transfer from bucket/measurement to another
from(bucket: "iotawatt")

  |> range(start: v.timeRangeStart, stop: v.timeRangeStop)
  |> filter(fn: (r) => r["_measurement"] == "energy")
  |> filter(fn: (r) => r["_field"] == "kwh")
  |> to(bucket: "energy", org:"phisaver")
Counting lotsa points
The imported database is too big. It has 1 billion points. It explodes (memory) on large queries, even simple ones. For example, to get the total number of points, a “SELECT count(*) from iotawatt” fails. Instead we can batch queries by date and device. For example (v1):
       q = 'show tag values from iotawatt with key = "device"'
       r = self.client.query(q, database=self.args.database)
       devices = [i['value'] for i in list(r.get_points())]

       for device in devices:

            interval_start = pytz.timezone(
                "Australia/Brisbane").localize(dt(2018, 1, 1))

            while interval_start < pytz.timezone("Australia/Brisbane").localize(dt.now()):
                interval_start += timedelta(days=30)
                interval_end = interval_start + timedelta(days=30)
                q = "SELECT COUNT(Watts) FROM iotawatt"
                q += f" WHERE units = 'Watts' AND device='{device}' "
                q += f" AND time > '{pyrfc3339.generate(interval_start,utc=False)}'"
                q += f" AND time <= '{pyrfc3339.generate(interval_end,utc=False)}'"
                q += " GROUP BY time(1h), sensor, device fill(0)"
                r = self.client.query(q, database=self.args.database)
Downsampling
I want to downsample from “iotawatt” (10s to 60s interval) to “power” (5m intervals). Ideally, a single Task can do this, but alas, there are too many points and it explodes.
I first tried using the python client but it was really slow on writes. Py
Instead I wrote the queries (example below) to seperate files and then, on the server, ran
for FILE in *.query; do influx query --org phisaver -f $FILE; doneAn example query for downsampling
from(bucket: "phisaver/autogen")
// change in each file
|> range(start: 2021-06-28T00:00:00+10:00, stop: 2021-12-27T00:00:00+10:00)
|> filter(fn: (r) =>(r["_measurement"] == "iotawatt"))
|> filter(fn: (r) =>(r["_field"] == "Watts"))
|> filter(fn: (r) =>(r["device"] == "uq85"))
// removes random tags not needed now
|> keep(columns: ["_time","_field","_value","device","sensor","units","_measurement"])
|> aggregateWindow(fn: mean, every: 5m, createEmpty: false)
|> to(bucket: "power", org: "phisaver")
This works but is not pretty. Must be a better way?
For new data, a Task with a limited time span (e.g. 24h) should be about to handle all devices at once.
Power to Energy : Downsampling with a twist
Same approach: use seperate queries to bin time.
from(bucket: "iotawatt")
|> range(start: 2020-02-26T00:00:00+10:00, stop: 2020-03-04T00:00:00+10:00)
|> filter(fn: (r) =>(r["_measurement"] == "iotawatt"))
|> filter(fn: (r) =>(r["_field"] == "Watts"))
// strip extraneous tags
|> keep(columns: ["_time","_field","_value","device","sensor","_measurement"])
// rename a field
|> set(key:"_field", value: "kWh")
// W -> Wh: integral is better but mean ok
|> aggregateWindow(fn: mean, every: 1h, createEmpty: false)
// Wh -> kWh
|> map(fn: (r) => ({ r with _value: r._value / 1000.0}))
|> to(bucket: "energy", org: "phisaver")
Deleting
I found it easiest from the cli on the server:
influx delete --bucket "phisaver/autogen" --start 2015-09-01T00:00:00+10:00 --stop 2021-12-31T00:00:00+10:00 --org phisaver -p 'device="apbee" and _measurement=iotawatt'To “clean” ridic data (like 1.1e1000 Watts), you cannot delete “values greater than X” (reference). So you first find the day and then delete a time range. Get the
// Find out-of-range values (slow)
from(bucket: "power")
  |> range(start: v.timeRangeStart, stop: v.timeRangeStop)
  |> filter(fn: (r) => r["_measurement"] == "iotawatt")
  |> filter(fn: (r) => r["_field"] == "Watts")
  |> filter(fn: (r) => r["_value"] > 1000000.0 or r["_value"] < -1000000.0)
  |> group(columns: ["device"])
  // optionally, just show days
  |> aggregateWindow(every: 1d, fn: count, createEmpty: false)
And then delete the whole day/s will dud data:
influx delete --bucket power --org phisaver -p 'device=rc352 and _measurement=iotawatt' --start 2021-08-25T00:00:00+10:00 --stop 2021-08-26T00:00:00+10:00Flux and InfluxQL
Flux is great but a bit hard to get started. I needed to read the docs and use the sample doc at influxdata.com.
Custom Functions
//
// Often can get the average kWh/day, then multiple values by 24 to get kWh/day efficiently
// This function helps
//
daily = (tables=<-) =>
  tables
    |> map(fn: (r) => ({
      r with
      _value: r._value * 24.0
    })
  )
Handling Empty Tables
There are ways to handle null values (Googlable) but what if you need to pivot a table with a missing (empty) row? You can do this:
// Export and Import are in two rows: pivot to columns for calcs
|> pivot(
    rowKey:["_start"],
    columnKey: ["sensor"],
    valueColumn: "_value")
// How we have a single row with columns Export, Import and _value
// However, Export might be empty. We need to set it to 0 for future calcs
|> map(fn: (r) => ({
    r with
      Import :   r.Import * 24.0  , // will always exist
      Export : if exists r.Export then  r.Export * 24.0 else 0.0 , // *** set to 0 if empty ***
  })
)
Calculating between rows to find fraction of solar contribution
Unioning Recent (finely sampled) and Historical (downsampled) Data
Below is a working approach but it fails in Grafana if the ‘dsCrossOverTime’ is not within the window being viewed. It could be adapted.
import "math"
import "experimental"


// iotawatt bucket has a RP of 1 week so exclude downsamples (power) data after that
dsCrossoverTime = experimental.subDuration(
  d: 7d,
  from: now(),
)


// Stop at the first of crossover or window end
// Too complex - dont use
ds_f = math.mMin(x: float(v:uint(v:dsCrossoverTime)), y: float(v:uint(v: v.timeRangeStop)))
ds_uint = uint(v: ds_f)
ds_time = time(v: ds_uint)

downsampled=from(bucket: "power")
  |> range(start: v.timeRangeStart, stop: dsCrossoverTime)
  |> filter(fn: (r) => r["_measurement"] == "iotawatt" and
                       r["_field"] == "Watts" and
                       r.device == "${device}"
  )
  |> aggregateWindow(every: v.windowPeriod, fn: mean, createEmpty: false)
  |> keep(columns:["_time","sensor","_value"])


  recent   = from(bucket: "iotawatt")
  |> range(start: dsCrossoverTime, stop: v.timeRangeStop)
  |> filter(fn: (r) => r["_measurement"] == "iotawatt" and
                       r["_field"] == "Watts" and
                       r.device == "${device}"

  )
  |> aggregateWindow(every: v.windowPeriod, fn: mean, createEmpty: false)
  |> keep(columns:["_time","sensor","_value"])

  union(tables:[downsampled,recent])
  |> yield()
One thought on “InfluxDB v2 (Flux) Setup for Energy and Power Data from Iotawatt”
Hi Brett. Thanks to your site – I’ve been working on setting up my Iotawatt system with Influxdb 2.0 and grafana. Your Influxdb v1 examples were very helpful. I’m hoping to read more about getting v2 up and running. Your live phisaver site is not showing any data. Is this part of the v1 to v2 transition?