I need to flash the IotaWatt firmware (and write new files to the SD card) for two reasons: firstly I have a bricked IotaWatt, and secondly I want to try to modify the firmware to sample at 1 seconds intervals.
Resources
- https://community.iotawatt.com forum for when it all goes wrong.
- Sample rate query which is not too promising!
- Unbrick simple on windows
- Release of (compiled) firmware to flash
- Github for source and sd files
- Old post which indicates using VScode and platformIO
- Archived Code for cycle saver
Don’t be an idiot, like me
- Use a good USB power supply!
- Use a good USB cable!
Linux
Check Serial
You can get more info from the serial monitor. Some options
- use PlatformIO serial monitor (e.g VSCode->Install PlatformIO->
pio device monitor --baud 115200) - use “Serial Montior” in VSCode (extension)
- esptool.py (see below) with
esptool chip-idis a good way to check of an ESP device is connected.
Just Flash the Bastard
- Install esptool.py : this will communicate with the ESP8266. Using version 2.5.1
- Get the firmware and flash it
# Get binary (or browse github)
wget “https://github.com/boblemaire/IoTaWatt/releases/download/02_05_02/firmware.bin”
# Check connection after plugging in ESP8266 / IotaWatt
esptool.py –chip esp8266 –port /dev/ttyUSB0 chip_id
# id is 0x00268c51, mac is 84:f3:eb:26:8c:51
# Write flash (no baud required…?)
esptool.py –chip esp8266 –port /dev/ttyUSB0 write_flash 0 firmware.bin
# flashy green, ya!
Aside: Windows
Just flash the bastard
- Install VSCode
- Install python (for esptool). I used latest 3.11
- Then in terminal of VSCode:
# Install esptool (python)
py -m pip install esptool
# Get the latest firmware (will change over time)
wget -outfile firmware.bin https://github.com/boblemaire/IoTaWatt/releases/download/02_07_05/firmware.bin
# Plug in via USB and flash it - auto detects port
esptool.py --chip esp8266 write_flash 0 firmware.bin- If you need new SD card files, just pull it out, pop in a PC, get zip here github and copy files across.
Back to linux
Build from source
This will be harder. Bob says he uses PlatformIO and VScode on Windows. On do the same but on linux. I’ll try to build from github.
# fork repo on github via browser
# get local repo
git clone https://github.com/brettbeeson/IoTaWatt.git
cd IotaWatt/firmware
Now we need PlatformIO. I’ve heard it’s good, so let’s install it and try to get it running:
- Install VSCode and install PlatformIO IDE as an extension. Update VSCode via apt-get
- Try a blink on ESP8266 with PlatformIO with board=ESP-12E and framework=arduino (match IotaWatt platform.ini). This works out-of-the-box.
That’s really easy. Also installed 99-udev as recommended by compile system. Now let’s try and build IotaWatt:
- In VSCode, open a PlatformIO Project and point it to Firmware/ where the platform.ini file lives, and then ‘build”
Unsurprisingly, this fails with errors. Let’s work through them:
- Library finder in platformIO found multiple options for RTCLib, Crypto. It uses the first one. However, it ends up with all the right (i.e. as per platformio.ini) versions.
- Cannot find iotawatt.h when compiling “.pio/build/iotawatt/src/Setup.cpp.o”. Just a case-sensitive typo. Fixed.
- Builds OK <shocked-face>
- Uploading fails as trying to go to COM3. In platform.ini, just commented out the upload_port to use auto-detect.
This works. Takes 17s to build and upload after a minor change. Now let’s write a hello world in setup() and try to view the output on the usb. Using the serial monitor in VSCode we can see output of log() and Serial.println() commands.
So, that’s it: we can building, compile and flash the IotaWatt.
Hack for faster sampling
This is where things get interesting. I want to record samples at 1s intervals or each less. This might be possible with minor changes – I’ll try turning off everything not required and see if I can force it to record faster. Even faster will probably require a new approach. Let’s try:
Naively force interval to 1 second
Guess: For 10 channels, given we sample 30 cycles per second, we have 3 cycles per channel per second. IotaWatt logs at 5s intervals. We are hence averaging 3 x 5 = 15 samples and logging the average.
If we force the log interval to 1s, we would be averaging 3 samples. Let’s hack that in. Firstly, change Firmware/IotaWatt/common.cpp to record to currLog at 1s intervals
//IotaLog currLog(5,365);                     // change to
IotaLog currLog(1,30);
Then on the iotawatt/sdcard/config.txt (this has to be manually edited by the File Editor, instead of the web app), change the postInterval to 1 second instead of 5,10, etc. Set bulk send for minutely uploads
"type": "influxdb",
         "revision": 2,
         "postInterval": 1,
         "bulksend": 60,
Now reboot and check the database: we see readings each second. However, let’s consider wtfwaad for a minute. These readings are based on 10 samples a second (30 AC cycles sampled per second, says IotaWatt, and we have 3 channels). This seems reasonable (10 samples), but fewer seems too few. So 1s resolution is looking like the minimum for a few channels, and 5s for more channel.
To confirm this “seems reasonable” we need to see if the 1s variations are just noise. Maybe:
- some kind of statistical test
- attach a quality, constant load and see if it varies at 1s intervals.
- attach some kind of signal generator (e.g. square waves at nth second intervals) to test it?
One second sampling: is it just noise?
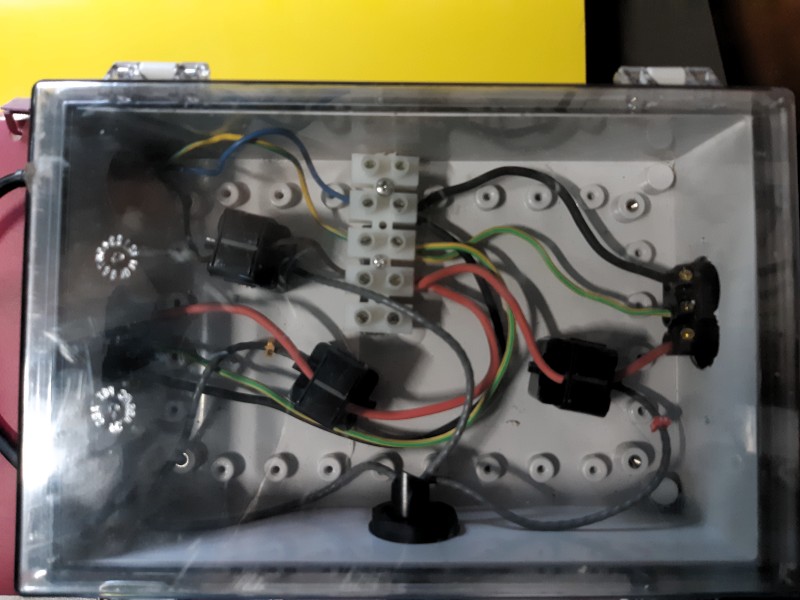
I’ll test the value of 1s sampling via option #2 from the list above. Three CTs were measured:
- total supply power
- a CFL light
- a constant load (soldering iron without temperature control)
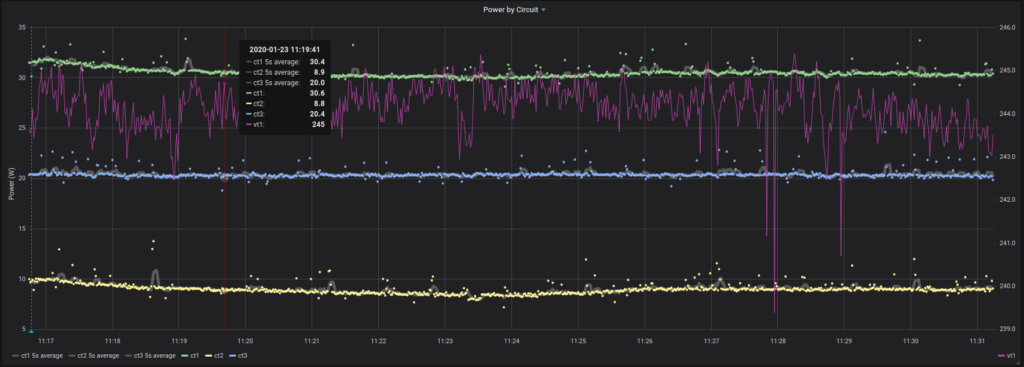
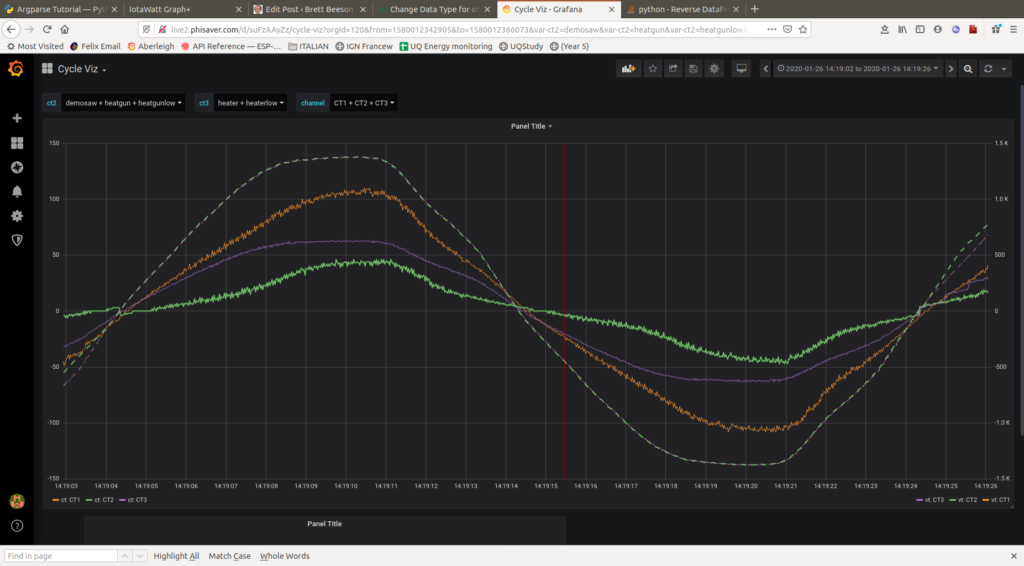
There is an interactive version to explore too. And a csv file.
Based on this we can draw a few conclusions. The voltage is pretty steady (+-1 V). The broad (10s average) values for the CTs are steady. We see the CT2 slowly changing (as it heats up, perhaps). At 1s resolution (about 10 samples?) there is some ‘noise.’ Is this real variations in power, which we could use to identify appliances? No, probably not: CT2 and CT3 are on seperate loads. Their noise does not correspond to CT1 which is on the total supply. If the loads’ power input were really varying, we would expect to see a correlation between CT1 and (CT2 or CT3). Hence, I think the noise is measurement error from the CT and associated circuitry. This implies higher-frequency sampling of power (i.e. <1s) is meaningless as we’d just be seeing noise. Sampling at 5s (dim lines in the chart) is probably the useful limit.
So, one second sampling is not useful, at least using this device. The inventor commented here, suggesting the ‘noise’ is software-based: it is due to the sampling processing being sometimes interrupted.
Let’s try to…
Capture a “signature” cycle
Energy logger work by sampling the voltage (V) and current (I) waveform via VTs and CTs. These are read by ADCs and a digital value is feed to the microcontroller. 700 or so samples per 20ms (1 cycle @ 50Hz) are used approximate the voltage and current waveforms. Based on these waveforms, the power/voltage/power-factor/etc are calculated.
So what? Well, the units record the cycle in a simple array. We could save this as a “snapshot” of the AC cycle. Different devices will have different ‘signatures’ (shapes) even if their total power is the same. Therefore, having the waveform (and macro-level power data) might enable better dis-aggregation.
Let’s try to save a waveform, download it and view it. Some approaches to consider. All call “saveCycleSamples()”
- Add a SERVICE like the statService to call saveCycleSamples() after one second delay, when the next channel to save is sampled.
- in samplePower(), after samples are taken, call saveCycleSamples() every nth cycle taken.
- use the iotawatt.local/command=sample API which calls the sampleCycle() on a given channel: perfect.
The SERVICE is more modular and shouldn’t interfere with other operations. The API method is easier and will start with that. A SERVICE could also call this (directly) and save/upload the data.
For the API method:
# wget http://10.1.1.6/command?sample=1

-7,0 -23,0
-38,0
-50,-2
-63,-3
-76,-3
-89,-4
...
35,0
22,0
8,-2
-6,-2
And graphing one of these it looks good:
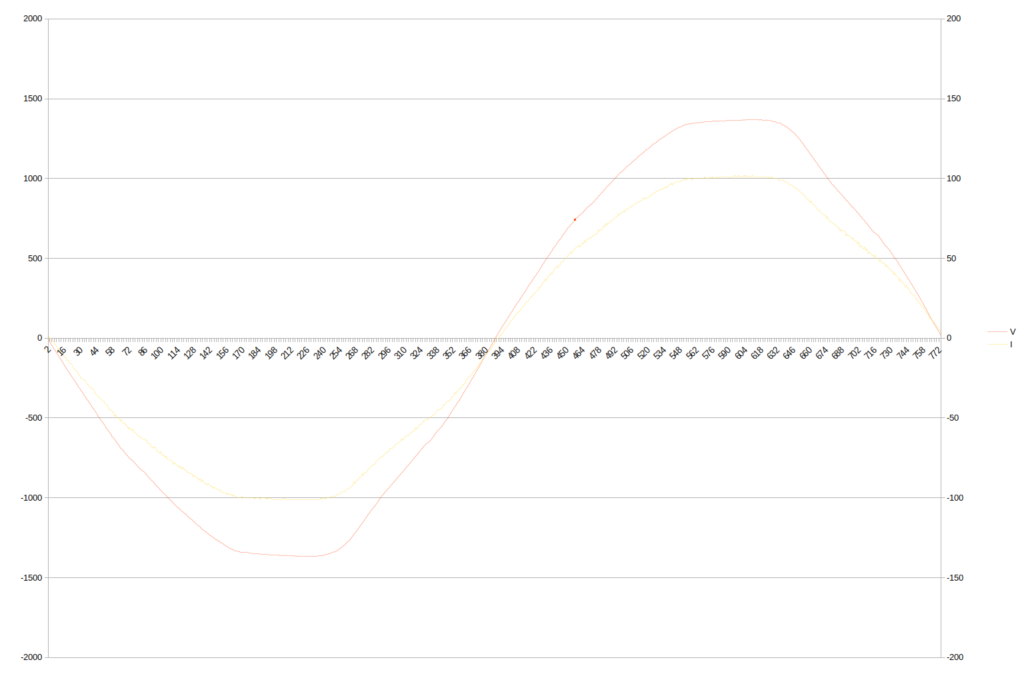
Other samples looks good too. We need some way of storing, visualising and comparing these. Hey: InfluxDB does that. Flot as another option – nice way would be to AJAX-poll the endpoint and display a channel pair (V,I) based on a dropdown. I’ll go Influx as I wanna store them.
So let’s write a script to call that http-based API every n seconds. It should call it once for each CT channel and quickly put it into a list or panda dataset or something. Timestamp that and then write to influx. The influx structure (for nice viz) could be:
| time | value | channel | type | |
| time-of-start-of-cycle1 | integer ADC value (later: amps | [1..14] | [vt,ct] | |
| time-of-start-of-cycle + ([1..N] / N) * cycle_length (1000ms / frequency) |
For each channel, C, there will be rows with:
time1.0,532,C,vt
time1.0,532,C,ct
time1.1,532,C,vt
time1.1,532,C,c
Technically, the channels after the first will be sampled 20+ms later (i.e. one or most cycles later). However, it will be better to set their time-of-start to that of channel 1. This will enable plotting on the same graph. We are therefore assuming cycle shapes don’t change within a few cycles period.
So each set of samples will have a common start time. When comparing samples, the number of samples changes (eg 700 to 750). We also don’t know the cycle period (approx 20ms). Either ignore these issues (bad), resample to (say) 700 samples over a fixed 20ms (nicer in the db, might introduce stat errors), or timestamp each channel’s samples (at intervals of n/N * cycle_length where n is the number of samples). The last might be a shit to upload but who cares. I’ll start with that.
Therefore, when collecting the samples from the CSV output, I’ll:
- assume or request frequency and assume fixed cycle length
- save the start time and apply to all channels in the set
- for each channel, store in a list ct_name => [time,V,I] where time increments depending on the number of samples. Since they have the same time, they can be batch written.
- upload everything and wait
Notes about IotaWatt codebase (best guesses)
- HistoryLog: A file and a service. 1min resolution. No holes so addressable (via starttime and offset?). Created from the DataLog (current log) and of the same format. For high sampling rates, no changes here.
- DataLog: A file and a service. Stored when running, ordered but with holes. Given two records, we can find all values (PF, A, etc)
- LogRecord format:
- Date stamp
- Contains two “accumulators” which storage information about the VT and the CT.
- There is a ‘bucket’: a union of “dataBuckets” type which store 1 of 3 things: undefined accumulator, voltage or power infomration.
- Instead of FreeRTOS, there are custom “serviceBlock” services. A list (serviceQueue: linked list) is stored.
- samplePower.cpp is the guts of sampling and sampleCycle() is the key function.
- loop(): (Loop.cpp, which has a nice summary)
- Iterate through channels. Hence few channels = better sampling
- Call samplePower():
- “channel” is assumedly one of the 14 inputs. There are “power” and “voltage” channels
- each power (i.e. CT) channel has an assoicated voltage channel
- for a channel, sample one full cycle with sampleCycle():
- wait for V=0, then sample until V=0 twice more (V=0 => a crossing of waveform). This gives on full cycle.
- samples from the ADC are put in rawI (and rawV). And then into a file-global IsamplePtr[samples] and VsamplePtr[]. [ I think this is the waveform. We could record this array somewhere once every 10s or so for upload/analysis]
- process these sample arrays: adjust for offsets, reversing, etc. Compute I and V squared for late use (?)
- back in samplePower(), some fancy phase correction (don’t understand) is done and the IsamplePtr arrays are use to recompute adjusted Vsquared, Isquared, sumVI values.
- these adjusted values are used to find watts, V, I, VA. (From these we can derive PF, etc if required.)
- singular power and voltage values are stored in global inputChannel[channel]. This represents the power and voltage for one cycle. It is a “sample”.
- hardware sampling (sampleCycle()) uses SPI to get ADC values (?). We get about 700 samples per cycle (@ 50Hz). At 50Hz, there are 1000/50=20ms per cycle.
- running reports about 30 “cycles sampled per second”. So I think if we have, say, 10 channel, we will sample each channel 3 times. If we have 3 channels, we can sample a channel 10 times per second. ???
- For power: At most, we could be perhaps 30 cycle-samples per second, or 3 channels reporting at 0.1s intervals. In each second we would have 20ms x 3 x 10 = 600ms of sampling and 400ms for other operations.
- For waveform, we could record IsamplePtr and VsamplePtr from time to time. Save to SD card in another timestamped file and upload/serve at a later time, either to influxdb or download from SD card.
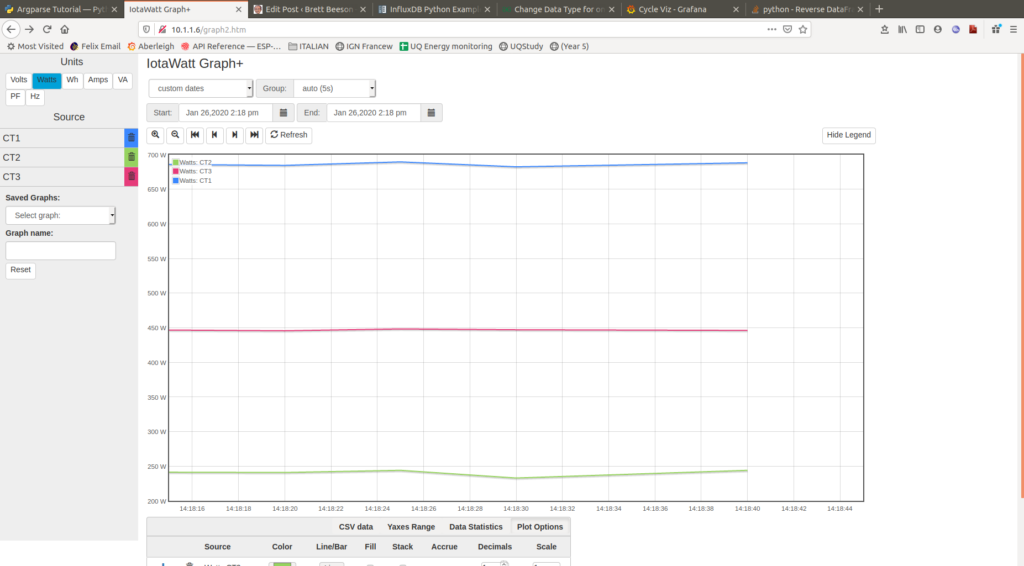
IotaWatt API Commands
- http://hfs02a.local/feed/list.json List of ‘feeds’. Actually same as channels. Each channel is tagged “Voltage”, “Power” or “Energy”.
Flash Codes
   // LED codes

#define LED_CONNECT_WIFI            "R.G.G..."              // Connecting to WiFi, AP active
#define LED_CONNECT_WIFI_NO_RTC     "R.R.G..."              // Connecting to WiFi, AP active, nofail
#define LED_SD_INIT_FAILURE         "G.R.R..."              // SD initialization failed
#define LED_DUMPING_LOG             "R.G.R..."              // Dtatlog damage, creating diagnostic file
#define LED_HALT                    "R.R.R..."              // Fatal error, IoTaWatt halted
#define LED_NO_CONFIG               "G.R.R.R..."            // No configuration file found
#define LED_BAD_CONFIG              "G.R.R.G..."            // Could not parse config file
#define LED_UPDATING                "R.G."                  // Downloading new release