This post describes how to setup IotaWatt on a single-database (multi-tenant) arrangement in Influx.
Previously I described single database setup for Influx, Grafana and IotaWatt. Much of that information is relevant, but changes are noted here.
Setup database (once)
It’s better practice to use one database for many iotawatts, but can be confusing. Note there are security implications. Experts only!
#bash>  influx
# first time only:
CREATE DATABASE phisaver
USE DATABASE phisaver
CREATE USER reader WITH PASSWORD 'password' WITH ALL PRIVILEGES
GRANT READ ON phisaver TO reader
CREATE USER writer WITH PASSWORD 'password' WITH ALL PRIVILEGES
GRANT ALL ON phisaver TO reade
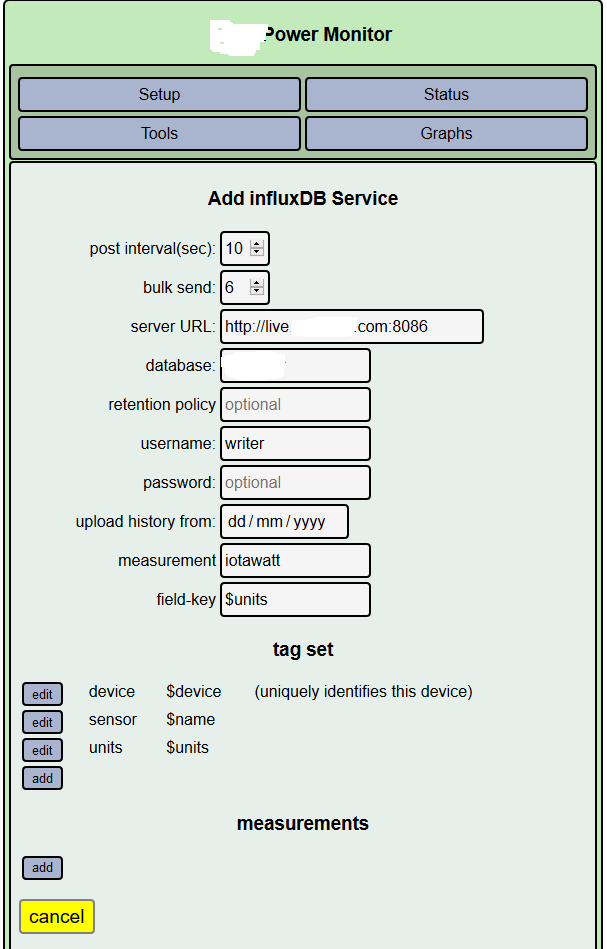
Setup Iotawatt (each)
We use tags to differentiate different iotawatts. Hence in IotaWatt setup we use:
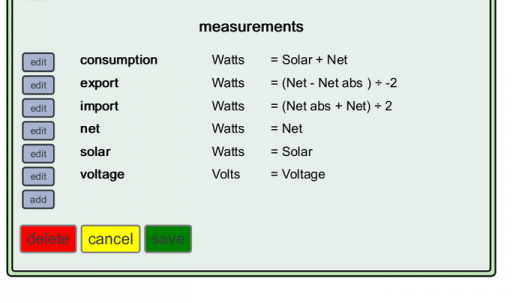
It’s also worth doing any simple arithmetic at this stage to ease life later. This is useful for multiple-circuits-of-one-type and sub-boards. For solar setups, it’s helpful to report the export and import separately, based on the a CT on the supply cable as follows. For example:
Naming of Circuits
After much experimenting I keep it simple. Everything is positive. This is easier to manage, although not technically right. The only exception is “Net” which can go negative. Derived (as opposed to direct CT reads) are italicized.
- Net: a CT (or 3 phases, added together) at the meter. Can be negative (export) or positive (import).
- Production: such as solar.
- Lights1, Powerpoints1, Powerpoints2, Pool, Aircon1: standard circuits
- Export: -1 x (0 Max Net). Not a CT
- Import: 0 Min 0 Net. Not a CT.
- Consumption: Sum of all circuits (Lights1 + Powerpoints2). This is not a CT.
- HotwaterOP, PumpOP : add “OP” to any circuits running off peak
- NetOP: Off peak at the meter, if used.
Automate config.txt file creation
A skeleton config file can easily be adapted – python is good JSON
./venv/bin/python ./phi-iotawatt-setup.py iotawtt-config/config.txt hfs01a Net Lights1 Power1 Power2 HotwaterOP Misc1 Oven
Setup InfluxDB Queries
So we’re got data in InfluxDB and could just graph that directly. That’s good for fine-grained, recent data. But for longer-term data we don’t want to continuously be summing from power-to-energy. So we create a Continuous Query to do this:
# Once only
 CREATE CONTINUOUS QUERY cq_1 ON iotawatt RESAMPLE EVERY 1d FOR 30d BEGIN SELECT integral(Watts, 1000h) AS kwh INTO ilcibne.autogen.energy FROM ilcibne.autogen.iotawatt WHERE units = 'Watts' GROUP BY time(1h), c t, device fill(0) END
CREATE CONTINUOUS QUERY kwh_h ON ilcibne RESAMPLE EVERY 1h FOR 1d BEGIN SELECT integral(Watts, 1000h) AS kwh INTO ilcibne.autogen.energy FROM ilcibne.autogen.iotawatt WHERE units = 'Watts' GROUP BY time(1h), ct, device fill(0) END
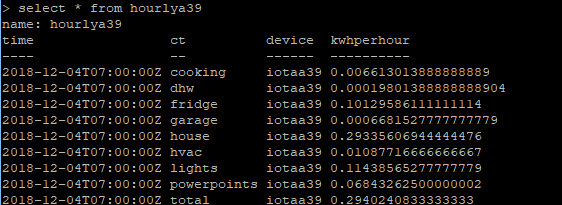
This creates hourly energy data with the right tags. It integrates power over time. Some tests shows much better performance and memory usage in InfluxDB using this method, particular for “Total Energy” type queries.
The “resample” syntax forces the query to run every day and process the last 30 days’ data. This processes data uploaded in bulk after an outage. The “kwh_h” query does the same thing, but runs every hour to keep the dashboard up-to-date.
Watchout for a gotcha: if you don’t have data for an interval, the integration will continue the last know value as constant. This can result in overly large (or small) values. This is a known InfluxDB problem. The fill(0) is ignored in the continuous queries. The only solution is to write a complex query to backfill unknown values with 0.
Grafana
So all the data are in the database, nicely tagged, and we’ll find that graphing is easy. It’s a standard connection to InfluxDB, and pretty straightforward to graph simple metrics. Some tips:
- Limiting unnecessary hits on the database:
- Check the returned results using “Query Inspector”.
- For single values, use last() or similar
- For power readings, typically the last week is enough. And often it’s only the instantaneous reading that’s important. However, I keep all the 10s readings.
- For further back, use energy (kwh/hour, as created in the continuous query) to plot such graphs as “energy per day” and pie-charts.
Scripting Grafana Setup
To setup grafana, we can use the api via python to create users, add a dashboard, etc.
phi-grafana-setup-user.py
Validating sums and circuits
If you have named the CTs nicely, you can create a multi-value variable which contain a list of the categories. Sum them to confirm they equal the total incomer and total sum of individual circuits. This is often more trouble than it’s worth, but cool:
# Incomer should equal …
SELECT sum("Watts") FROM "iotawatt" WHERE ("device" =~ /^$device$/ AND "ct" =~ /^$total$/) AND $timeFilter GROUP BY time($__interval) fill(null)
# … sum of categories should equal …
SELECT sum("Watts") FROM "iotawatt" WHERE ("device" =~ /^$device$/ AND "ct" =~ /^$cats$/) AND $timeFilter GROUP BY time($__interval) fill(null)
# … should equal sum of circuits …
SELECT sum("Watts") FROM "iotawatt" WHERE ("ct" =~ /^$circuits$/) AND $timeFilter GROUP BY time($__interval) fill(null)
Useful queries
Find the % of a arbitrary target (kwh/day). Note sometimes it’s necessary to force the timezone to be appended (use a fixed variable). This appears to be a bug.
SELECT sum("kwh")/$targetkwhperday FROM "energy" WHERE ("device" =~ /^$device$/ AND "ct" =~ /^$total$/) AND $timeFilter GROUP BY time(1d) fill(null) $timezone
Based on current time period, how much are your yearly bills? ($1 per day + $x per kwh)
SELECT mean("kwh") *8760/4*$DollarsPerImportKwh+$DollarsPerDay*365/4 FROM "energy" WHERE ("ct" =~ /$Consumption/) AND $timeFilter
Based on current time period, how much are your quarter bills? ($1 per day + $x per kwh)
SELECT mean("kwh") *8760*$dollarsperimportkwh+365 FROM "energy" WHERE ("ct" =~ /^$total$/ AND "device" =~ /^$device$/) AND $timeFilter
Find the current (“last”) top n power (Watts) circuits (ct):
SELECT top(Watts,3) as Watts from (SELECT last("Watts") as Watts FROM "iotawatt" GROUP BY "ct" fill(null)) group by ct
Tips on using Templates Variables
To get a list of all values in a tag field, use a “custom” variable and fill from influx via a query.:
show tag values with key = "ct"For more control, if you name your outputs from IotaWatt such that they are separable by RegEx-s (see table of names, above), then you can use dynamic variables (“Query Variables”) to produce – dynamically- lists of outputs to graph in Grafana. For example:

The magic is the query:
show tag values with key="ct" where device=~/[[device]]/ and units=~/Watts/ and ct=~/^Cat/
which produces a list of all outputs from iotawatt (stored in “ct”) for a device (another, constant, variable) which starts with “Cat”. This will work when you reuse the dashboard, provided the output names (eg. CatPower) are correct. Note that “A template variable of the type Constant will automatically be hidden in the dashboard, and will also be added as an required input when the dashboard is imported.” Therefore, use “Constant” to get it exported.