This post summarises how I configure IotaWatt, InfluxDB and Grafana to display energy consumption. It uses an AWS EC2 instance. See installation for preliminary details and IotaWatt: Multi-Tenant Setup using InfluxDB
# bash
influx
# influx
CREATE DATABASE iotawatt-database-name
USE iotawatt-database-name
CREATE USER someuser WITH PASSWORD 'password' WITH ALL PRIVILEGES
# OR for existing user
GRANT ALL to bbeeson
# OR limit rights where possible (e.g. grafana only needs to read):
GRANT READ ON iotawatt-database-name TO iotareader

Setup IotaWatt
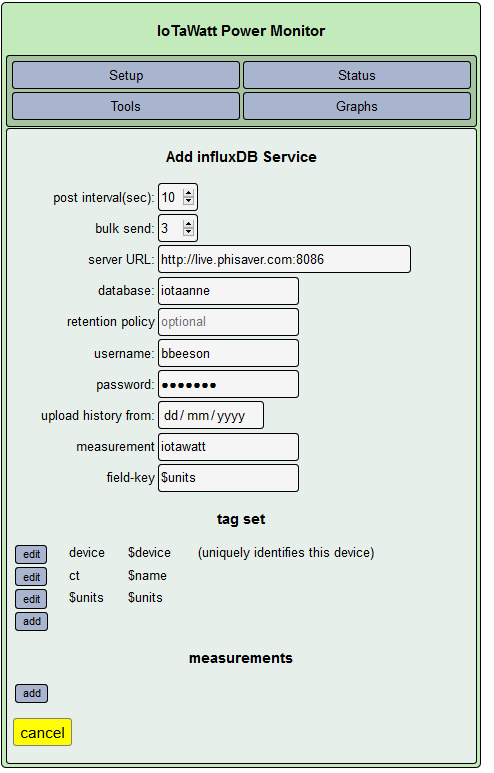
After the normal setup, configure InfluxDB uploading to look like this:
This will produce entries in InfluxDB like this:
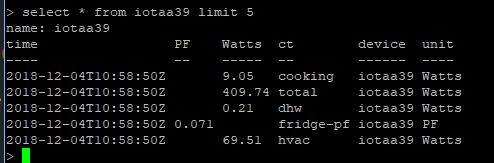
To SQL heads, this is a bit of a messy and sparse. But it turns out best for InfluxDB and Grafana because of the power of tags.
It’s also worth doing any simple arithmetic at this stage to ease life later. This is useful for multiple-circuits-of-one-type and sub-boards. For solar setups, it’s helpful to report the export and import separately, based on the a CT on the supply cable as follows. The odd maths is a sneak to simulate a “if less|more than zero” function. More on this below. For example:

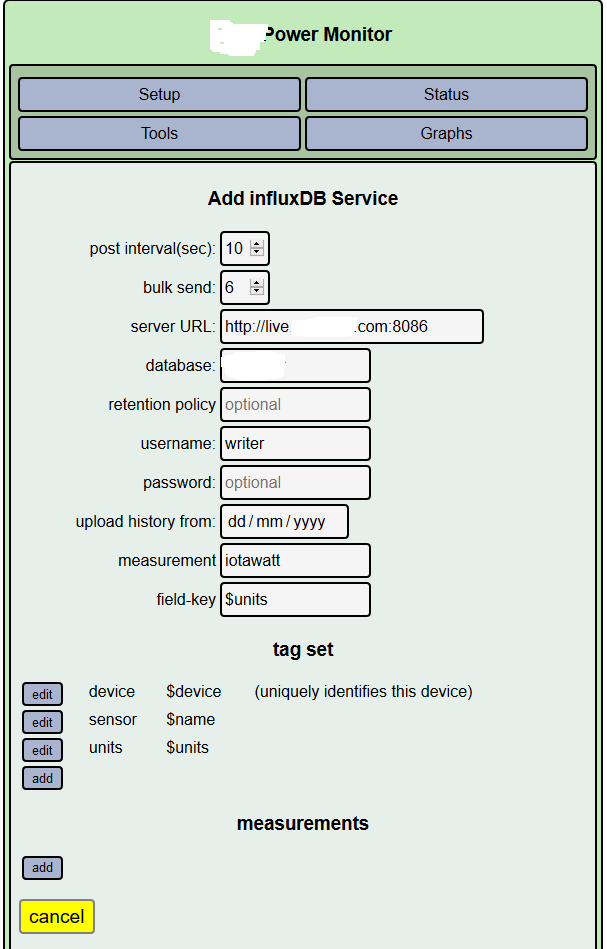
Method 2: One Mega Database (multi-IotaWatts)
It’s better practice to use one database for many iotawatts, but can be confusing. Note there are security implications. Experts only!
#bash
influx
# first time only:
CREATE DATABASE phisaver
USE DATABASE phisaver
CREATE USER reader WITH PASSWORD 'password' WITH ALL PRIVILEGES
GRANT READ ON phisaver TO reader
CREATE USER writer WITH PASSWORD 'password' WITH ALL PRIVILEGES
GRANT ALL ON phisaver TO reader

Then, we use tags to differentiate different iotawatts. Hence we get:
Naming of Circuits to Ease the Pain
One option is to identify circuits with a prefix (“Circuit”), in order to be able to use Regexs later. However, this turned out to be a furfy because it’s confusing, error prone and, most importantly, produces hard-to-read names.
So instead, I do this:
- Circuits: Use nice names, such as “PowerpointsUpstairs” and “LightsOffice“. Note the category is prefixed. It’s nice if there are clearly defined categories (Lights, Powerpoints) but this is not always the case (e.g. mixed circuits), so don’t worry too much.
- Categories: for categories of one, don’t do anything. For categories such as Powerpoints, create a IotaWatt output which sums them together and call it (e.g.) AllPowerpoints.
- Consumption: sum all consumption
- Production: sum all production. Simplest to keep this positive, but should be negative technically.
- Incomer: can be positive (importing)or negative (exporting)
Here is an example:
| CT Name | Note |
|---|---|
| HotWater | Circuit and a category |
| PowerpointsGarage | Circuit in the Powerpoints category |
| PowerpointsEnfantsVmc | Circuit in the Powerpoints category |
| PowerpointsAtelSdbBas | Circuit in the Powerpoints categor |
| LightsSousSol | Circuit in the Lights category |
| LightsSalonEscal | Circuit in the Lights category |
| LightsMaison | Circuit in the Lights category |
| Incomer | +ve or -ve ; This is the net power |
| AllConsumption | Sum of circuits |
| AllPowerpoints | Category total |
| AllLights | Category total |
| Export | Power exporting. Derived - see notes below |
| Import | Power importing. Derived - see notes below |
| SolarConsumed | Solar power used in-house. Derived - see notes below |
Note the convention for positive and negative. Technically for a control-volume / energy balance approach, all production should be negative. Then you can sum everything and get zero. However, it is confusing for people when you graph things later. So I made everything positive. The exception is Incomer (aka Net) which can be positive (importing) or negative (exporting). This is a bit hacky, but conforms to current norms and people’s expections.
To implement this, there are some tricks:
| Name | Sign | Meaning | Relation | IotaWatt |
|---|---|---|---|---|
| Import | +ve | Energy from grid | Incomer : Incomer > 0 | 0 max incomer |
| Export | +ve | Energy to grid. | Incomer : abs(Incomer<0) | 0 min incomer x -1 |
| SolarConsumed | +ve | Solar energy produced and consumed inhouse. | Solar - Export | solarandbatt + (0 min incomer) |
| Consumption | +ve | Direct CT or sum circuits | ||
| Incomer (aka "Net") | +ve Import and -ve Export | Consumption - Solar | Direct CT | |
| Solar | +ve | Production | Direct CT | |
Setup InfluxDB Queries
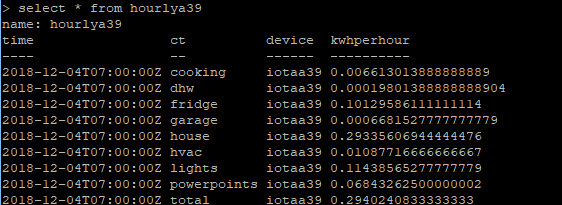
We’re got data in InfluxDB and could just graph that directly. That’s good for fine-grained, recent data. But for longer-term data we don’t want to continuously be summing from power-to-energy. So we create a Continuous Query to do this:
CREATE CONTINUOUS QUERY kwh ON ilcibne RESAMPLE EVERY 1d FOR 30d BEGIN SELECT integral(Watts, 1000h) AS kwh INTO ilcibne.autogen.energy FROM ilcibne.autogen.iotawatt WHERE units = 'Watts' GROUP BY time(1h), ct, device fill(0) END
CREATE CONTINUOUS QUERY kwh_h ON ilcibne RESAMPLE EVERY 1h FOR 1d BEGIN SELECT integral(Watts, 1000h) AS kwh INTO ilcibne.autogen.energy FROM ilcibne.autogen.iotawatt WHERE units = 'Watts' GROUP BY time(1h), ct, device fill(0) END
This creates hourly energy data with the right tags. It integrates power over time. Some tests shows much better performance and memory usage in InfluxDB using this method, particular for “Total Energy” type queries.
The “resample” syntax forces the query to run every day and process the last 30 days’ data. This processes data uploaded in bulk after an outage. The “kwh_h” query does the same thing, but runs every hour to keep the dashboard up-to-date.
Watchout for a gotcha: if you don’t have data for an interval, the integration will continue the last know value as constant. This can result in overly large (or small) values. This is a known InfluxDB problem. The fill(0) is ignored in the continuous queries. The only solution is to write a complex query to backfill unknown values with 0.
Grafana
So all the data are in the database, nicely tagged, and we’ll find that graphing is easy. It’s a standard connection to InfluxDB, and pretty straightforward to graph simple metrics. Here are some of the trickier bits
Limiting unnecessary hits on the database
- Check the returned results using “Query Inspector”.
- For single values, use last() or similar
Working with power versus energy
- For power readings, typically the last week is enough. And often it’s only the instaneous reading that’s important. However, I keep all the 10s readings.
- For further back, use energy (kwh/hour, as created in the continuous query) to plot such graphs as “energy per day” and pie-charts.
- In other words, don’t keep calculating the Integral
Using templating for flexibility and re-usability.
My workflow is currently:
- Create a nice dashboard and ‘pull out’ all variables as template variables.
- Export this (with the “templating” box ticked”) to a file
- Import the file to a new job
Master Template
Constants:
[[supply]] : ct name of supply (incomer, can be -ve)
[[solar]] : ct name of solar (positive)
[[consumption]] : ct name of consumption total
Custom:
cts : manually enter circuits
Validate sums and circuits
If you have named the CTs nicely, you can create a multi-value variable which contain a list of the categories. Sum them to confirm they equal the total incomer and total sum of individual circuits. This is often more trouble than it’s worth, but cool:
# Incomer should equal …
SELECT sum("Watts") FROM "iotawatt" WHERE ("device" =~ /^$device$/ AND "ct" =~ /^$total$/) AND $timeFilter GROUP BY time($__interval) fill(null)
# … sum of categories should equal …
SELECT sum("Watts") FROM "iotawatt" WHERE ("device" =~ /^$device$/ AND "ct" =~ /^$cats$/) AND $timeFilter GROUP BY time($__interval) fill(null)
# … should equal sum of circuits …
SELECT sum("Watts") FROM "iotawatt" WHERE ("ct" =~ /^$circuits$/) AND $timeFilter GROUP BY time($__interval) fill(null)
Useful queries
Find the % of a arbitrary target (kwh/day). Note sometimes it’s necessary to force the timezone to be appended (use a fixed variable). This appears to be a bug.
SELECT sum("kwh")/$targetkwhperday FROM "energy" WHERE ("device" =~ /^$device$/ AND "ct" =~ /^$total$/) AND $timeFilter GROUP BY time(1d) fill(null) $timezone
Based on current time period, how much are your yearly bills? ($1 per day + $x per kwh)
SELECT mean("kwh") *8760/4*$DollarsPerImportKwh+$DollarsPerDay*365/4 FROM "energy" WHERE ("ct" =~ /$Consumption/) AND $timeFilter
Based on current time period, how much are your quarter bills? ($1 per day + $x per kwh)
SELECT mean("kwh") *8760*$dollarsperimportkwh+365 FROM "energy" WHERE ("ct" =~ /^$total$/ AND "device" =~ /^$device$/) AND $timeFilter
Find the current (“last”) top n power (Watts) circuits (ct):
SELECT top(Watts,3) as Watts from (SELECT last("Watts") as Watts FROM "iotawatt" GROUP BY "ct" fill(null)) group by ct
Using Templates and Variables – Advanced
If you name your outputs from IotaWatt such that they are separable by RegEx-s (see table of names, above), then you can use dynamic variables (“Query Variables”) to produce – dynamically- lists of outputs to graph in Grafana. For example:

The magic is the query:
show tag values with key="ct" where device=~/[[device]]/ and units=~/Watts/ and ct=~/^Cat/
which produces a list of all outputs from iotawatt (stored in “ct”) for a device (another, constant, variable) which starts with “Cat”. This will work when you reuse the dashboard, provided the output names (eg. CatPower) are correct. Note that “A template variable of the type Constant will automatically be hidden in the dashboard, and will also be added as an required input when the dashboard is imported.” Therefore, use “Constant” to get it exported.
Alternatively, use a “custom” variable and manually edit the values. Get these from influx:
show tag values with key = "ct"
6 thoughts on “Iotawatt: Single Tenant InfluxDB and Grafana Setup”
Thanks for this. Was struggling with the IotaWatt + InfluxDB setup. It’s very helpful to see how you used the additional tags.
Thanks again,
Wish I had saw this earlier. I managed to get some nice dashboards but still struggle with Grafana under the “select” with mean, sum, distinct, count, median ect.. Know of any sites that explain the diff. output between them? The Grafan site has the definition of each but I struggle with when to select what for a wanted output. Thanks for the write up!
Hey Blitz. Yeah, they can be confusing. I created a minimal set of test data (eg. 20 readings) and used the command-line interface to Influx to run different queries, until I got the hang of it. In other words, I’d suggest looking at Influx (or your database of choice) first. Then Grafana will make more sense. InfluxDb docs are good.